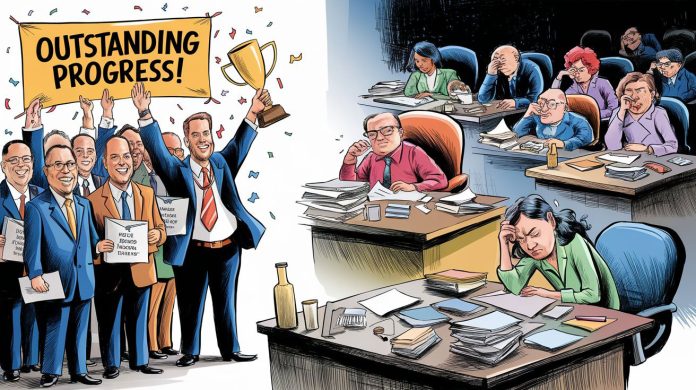
When does organizational celebration become organizational delusion? This November, the Board of Veterans’ Appeals leadership gathered to present awards for improved employee satisfaction scores, applauding what they deemed significant progress in their 2024 All Employee Survey results. The ceremony painted a picture of success and positive change. But like a masterful illusion, what you see depends entirely on where you’re standing… and what you’re willing to ignore.
The reality behind these celebrations tells a far different story. An agency that has plunged to the bottom 4% of government organizations, leadership metrics that remain below 2022 levels, and survey participation rates that have dropped so low they challenge the very validity of the results being celebrated. These celebrations mask a troubling truth: an organization more focused on highlighting selective victories than addressing its systemic failures.
Table of Contents
Behind the Smoke and Mirrors: The Real Numbers
At 444 out of 459 possible rankings in 2023, BVA sits at the 3.27 percentile across VA organizations – a dramatic decline from its 2022 ranking of 315 out of 432 subcomponent agencies. In any other performance context, scoring in the bottom 4% would trigger immediate intervention protocols, not celebration. For perspective, this performance level, if applied to state bar exam results, would represent a failure rate that would prevent any law school from maintaining its accreditation and would likely trigger an American Bar Association investigation.

In mid-November, BVA Chairman presented two 2024 AES awards: one to Senior Deputy Vice Chairman Santoro for the most improved division – Office of Appellate Operations (OAO), and another to Deputy Vice Chairman Scharnberger for achieving the highest score with the DVC 3 Team. These celebrations prompted AFGE Local 17 to work with data experts to conduct a thorough analysis, particularly given BVA’s troubling overall performance metrics and concerning leadership trends.
The Leadership Crisis
Earlier this year, AFGE Local 17 decided to look deeper into the 2024 AES data for the BVA. The data reveals a disturbing pattern in leadership effectiveness that coincides with the transition from Chairman Cheryl Mason to Chairman Jaime Areizaga-Soto:
- Senior Leader Workforce Motivation plummeted by 14.74% in 2023 (from 3.12 to 2.66) during this leadership change
- Despite some recovery in 2024 to 3.03 under the new administration, it remains below Mason-era 2022 levels
- Similar patterns emerge across all leadership metrics during this transition period:
- Senior Leader Ethics declined from 3.38 (2022) to 3.04 (2023)
- Senior Leader Respect dropped from 3.36 (2022) to 2.97 (2023)
- Engagement Driver for Senior Leaders fell from 3.50 (2022) to 3.16 (2023)

While 2024 shows some recovery in these metrics under Chairman Areizaga-Soto’s leadership, they have not returned to the levels seen during Mason’s tenure, indicating persistent leadership challenges through this transition. Hence, when Local 17 saw celebrations with the 2024 AES Awards, serious questions arose about what metrics were actually being celebrated.
The Statistical Anomaly
The comprehensive data validation analysis reveals a deeply concerning trend in survey participation. The DVC 3 Team’s response rate has steadily declined from 78.71% in 2021 to a troubling 61.76% in 2024. Similarly, OAO has seen its response rate drop from 76.06% to 65.81% over the same period. This represents a staggering 13.60% overall decline in participation since 2021.


These numbers are particularly alarming because they fall well below the industry standard threshold of 70-85% response rate for organizational surveys. This established standard determines the minimum level of participation required to capture an accurate picture of organizational sentiment. Research by Rogelberg and Stanton (2007) reinforces this concern, revealing that organizational surveys often miss crucial perspectives when participation drops – particularly from disengaged employees or those with serious concerns about leadership. Bartlett’s (2005) research further demonstrates that survey results become increasingly unreliable as response rates fall below 70%, potentially painting an artificially positive picture that masks underlying organizational issues.
The implications for the awarded teams are serious: for the DVC 3 Team, with only about 62% of employees responding, decisions are being based on a picture missing nearly 40% of its pieces. For OAO, with approximately 66% participation, one-third of employee perspectives are absent from the data. These missing responses might tell a very different story than the one being celebrated. When organizational units celebrate improvements while experiencing such significant declines in employee participation, we must carefully consider whether these results truly represent the full organizational reality.
The Real Story
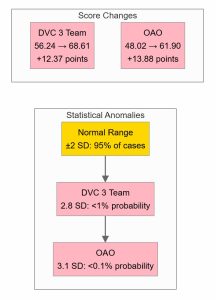
When we examine the employee engagement metrics against this backdrop of declining participation, the celebrated improvements become suspect. The DVC 3 Team’s “Best Places to Work” score jumped from 56.24 to 68.61 – a 12.37-point increase that represents a statistical anomaly of 2.8 standard deviations from the mean. OAO’s increase was even more dramatic, rising from 48.02 to 61.90, representing 3.1 standard deviations from the mean.

To put this in perspective, standard deviation is a measure of how much variation exists from the average change we typically see year over year. When a change is more than 2 standard deviations from the mean, it occurs less than 5% of the time by chance – making these improvements statistically improbable. At 2.8 and 3.1 standard deviations, these changes would naturally occur less than 1% of the time, raising serious questions about what’s driving these unusual improvements.
This combination of rising engagement scores paired with declining response rates presents a troubling paradox: the more employees opt out of responding, the better the scores become. It’s a pattern that suggests the most engaged employees are the ones most likely to respond, while those who are disengaged or dissatisfied simply stop participating. This self-selection bias creates an increasingly distorted picture – one where improvements in scores may actually signal a growing divide between engaged and disengaged employees, rather than true organizational progress.
The divergence between improving metrics and declining participation presents a fundamental challenge to data integrity. When an organization celebrates results drawn from an increasingly narrow respondent pool, it raises serious questions about whether we’re measuring actual improvement or simply distilling our data set to its most favorable elements.
The Persistence of Illusion
When an organization celebrates progress while 38% of its highest scoring DVC 3 Team’s workforce and 34% of its most improved division’s (OAO) workforce remain silent, we must ask ourselves what reality we’re choosing to see – and what truths we’re choosing to ignore. The illusion of improvement at BVA, constructed through selective metrics and divisional awards, obscures the deeper institutional challenges that persist unchecked. True progress isn’t found in isolated celebrations or carefully curated statistics. It emerges from honest assessment, comprehensive reform, and genuine accountability. Until we’re willing to look beyond the comfortable illusion and face our organizational challenges head-on, authentic progress will remain an aspiration rather than a reality.
Want to share your thoughts on BVA’s approach to the AES results? Local 17 continues to work with AES data to analyze results, identify trends, and provide comprehensive reporting on issues that matter to employees. Drop us a line through our anonymous suggestion box – “The Radar.” Whether you have insights on the survey results, experiences to share, or questions about our analysis, we would love to hear from you.
For additional detailed analysis, readers may refer to the source data extract and AES report appended below. These supplementary materials provide comprehensive background information for those interested in exploring the underlying data.
Data Sources & References
Academic Sources
Rogelberg, S. G., & Stanton, J. M. (2007). Introduction: Understanding and dealing with organizational survey nonresponse. Organizational Research Methods, 10(2), 195–209.
URL: https://journals.sagepub.com/doi/abs/10.1177/1094428106294693
Bartlett, K. R. (2005). Survey research in organizations: Foundations and methods of inquiry. In Swanson, R. A., & Holton, E. F. (Eds.), Research in Organizations: Foundations and Methods of Inquiry.
URL: https://www.drrichardgreen.com/uploads/3/4/5/2/34520924/swanson_and_holton-2005-research_in_organizations.pdf
Data Sources
The analysis in this article is based on the following AES Data Extracts:


